PhD defense: Visualizing Sequential Patterns in Large Datasets, 11/1
PhD Defense
Visualizing Sequential Patterns in Large
Datasets Using Levels of Abstraction
Dana Wortman
11am – 2pm, Friday, 1 November 2013, ITE 325b
Student retention and success are important topics in all academic fields and institutions. Faculty seek to understand which topics, theories, or skills defeat students or require strengthening to promote success. Programs seek to understand how to better sequence courses to ensure students are prepared for requisite future courses. Institutions seek to understand how to intervene to promote retention and improve graduation rates. Unfortunately, most statistics gathered by Institutional Research efforts are limited to failure rates, enrollment rates, and graduation rates and do not often explore individual student performance. While these are often further analyzed by various student demographic attributes such as race and gender, these statistical methods alone are insufficient to understand student performance over time and sequential patterns of enrollment or success and failure. This research presents a method using multiple levels of abstraction to visualize performance patterns over time.
To visualize student enrollment and performance patterns, several issues must be addressed including sequential versus concurrent enrollment, spatial layout of course events, and performance over time. Another challenge addressed by this work is that of presenting sequences within the context of the entire program. To address these issues, multiple abstractions are combined in a multi-layered visualization that presents a high-level overview of students enrollment and performance patterns while retaining detailed information regarding individual student progress and performance as they advance through their courses.
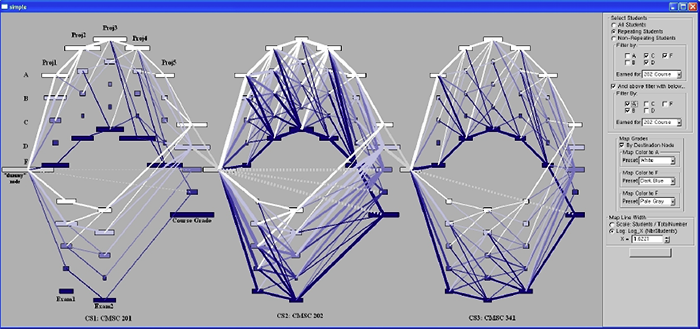
The aggregated view represents the lowest level of abstraction, student enrollment and performance are aggregated into a graph structure, presenting patterns of movement throughout the program at the individual course level. The clustered view represents mined sequential patterns of enrollment and performance, illustrating common sequences. The directed view represents the highest level of abstraction and uses two visual elements, heat maps and a vector field, to illustrate overall performance in individual events and movement through the program. Results from multiple cohorts can then be superimposed on the same visualization to enable easy comparisons between patterns. Together, these abstractions provide a focus+context view of student performance, retaining outliers and emphasizing common patterns to illuminate dominant and unique patterns between cohorts of students.
This approach can help educators better understand student progress through the program, performance in individual courses, or student-selected course sequencing and this information can be used to address deficiencies in preparation, skills, or prerequisites. To demonstrate the appropriateness of this approach, performance and enrollment patterns are explored in the Computer Science program at the University of Maryland, Baltimore County. Specifically, this work examines the Gateway policy that requires students to earn a B or higher in the first two required programming courses before progressing with the hopes of validating the existing Gateway but also exploring other possible Gateway courses. Other issues explored within the Computer Science program include race, gender, math placement, and high school scores with the goal of attracting and retaining a more diverse group of students.
Committee: Penny Rheingans (chair), Marie desJardins, Marc Olano, Tim Finin and Diane Lee
Posted: October 30, 2013, 1:14 PM